How to Set-up Adobe Edge Inspect
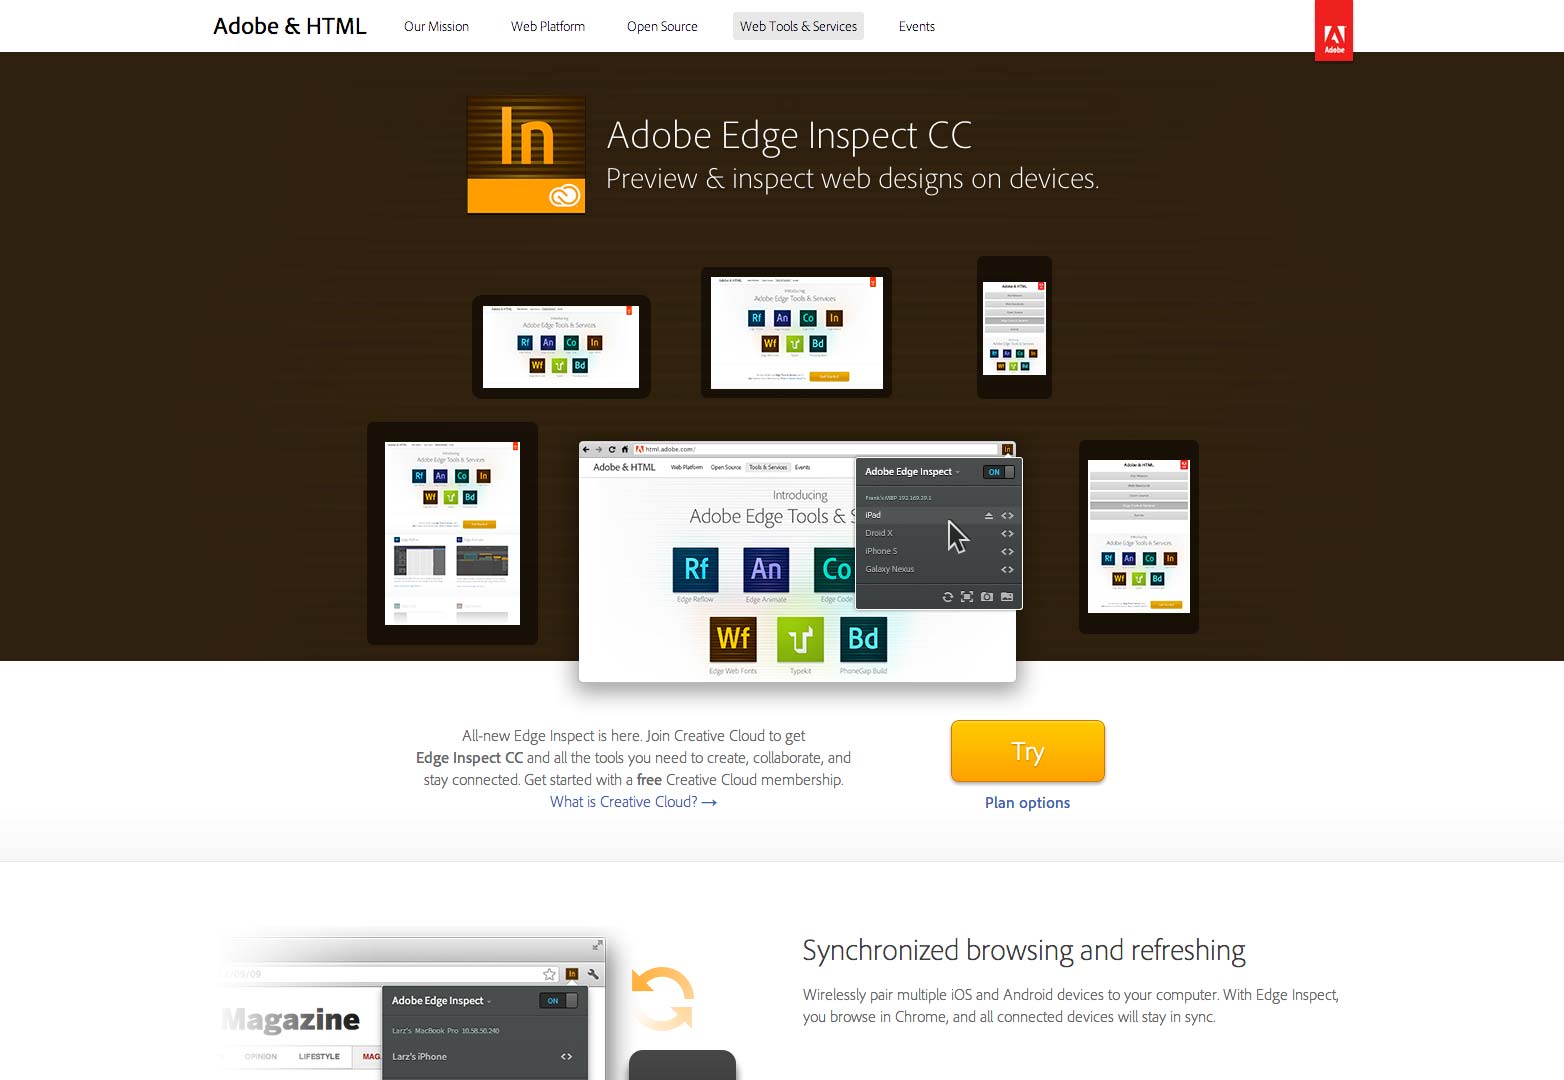
If you've ever built a mobile website, you know that testing and debugging across multiple devices can be cumbersome and, at times, downright painful. Adobe Edge Inspect helps resolve this by letting you easily control browsing across multiple devices. It then complements this with debugging and inspection tools that help you determine the exact causes of any issues.
Author:Frazer PughReviewer:Elisa MuellerMar 15, 2021156.5K Shares4.1M Views

If you've ever built a mobile website, you know that testing and debugging across multiple devices can be cumbersome and, at times, downright painful. Adobe Edge Inspect helps resolve this by letting you easily control browsing across multiple devices. It then complements this with debugging and inspection tools that help you determine the exact causes of any issues. Once you integrate Edge Inspect into your development workflow, you quickly start to see how much it improves that workflow when testing browser-based applications on devices. The more devices you need to test for your web app, the more time and effort Edge Inspect saves you.
This article covers how to set up Edge Inspect on your computer and your devices and then discusses some of its capabilities. Edge Inspect is available with a free Creative Cloud subscription. If you purchase a full Creative Cloud subscription or the Edge Inspect subscription, you get the full version. The free version allows a single connected device, while the full version does not limit the number of concurrently connected devices.
Setting Up
One of the most impressive parts of Adobe Edge Inspect, to me, is how quick and easy it is to set up. There are only three steps to the installation:
- Install Edge Inspect on your computer.
- Install the Chrome Extension.
- Install the Edge Inspect app on your iOS and/or Android devices.
Once you have everything installed, follow these steps to get started:
- Ensure that the Edge Inspect application is open on your computer.
- Open Edge Inspect on any devices you intend to test (keep in mind the single concurrent connection limitation if you are using the free version).
- Assuming all devices are on the same network as your computer, you should see your computer listed under Connections on each device.
- When you click the connection, you will be given a passcode.
- Within Chrome on your computer, you'll notice that a plus icon now displays on the Edge Inspect extension icon (generally, this extension is to the right of the address bar). Click on the icon, and type the passcode next to that device's listing (see Figure 1) to complete the authorization process.
You should begin seeing Edge Inspect on your device follow along with whatever you browse on your computer
Note:Though it may be obvious, if you are connected to a VPN, you may encounter difficulty having Edge Inspect on your device detect your computer.
After the initial pairing, you can open and close Edge Inspect on your computer or device without having to re-enter the passcode.
Browsing With Edge Inspect
Testing your pages with Edge Inspect is even easier than the setup. Simply browse using your Chrome browser, and all devices that have been connected will follow along. This enables you to test the appearance and behavior of any page on a variety of devices at the same time. Plus, Edge Inspect will keep your device from going to sleep, so you no longer need to unlock the device when you want to test the page. You aren't limited to just browsing within a single tab; Edge Inspect will display the content within the current tab as you switch across tabs.
Edge Inspect also lets you view pages in full-screen mode, removing the default Edge Inspect application chrome. To activate this feature, within the Chrome extension, click the icon for "show full screen on devices." You should see the top bar disappear on all devices browsing via Edge Inspect, and clicking the icon again within the extension will make it reappear.
Of course, browsing live web pages is useful, but most of the time you will be developing locally. (For more details on how to use Edge Inspect with virtual hosts, the Edge Inspect Team Blog has a number of posts on virtual hosts.) Thankfully, Edge Inspect fully supports browsing on your localhost, letting you test applications as you develop them.
Not surprisingly, Edge Inspect cannot load files browsed via file:/// as the file doesn't exist on your devices. As you might expect, if you are browsing password-protected pages, you will need to authenticate on each device. If you want to refresh the page or open the page within the browser on the device, simply click the icon in the upper right-hand corner of the Edge Inspect window on the device. As a tip, however, if your site uses HTTP Basic Authentication you can browse your URL using the format http://login:password@my.site.com/ to avoid re-authenticating on each device.
If you want to refresh the page or open the page within the browser on the device, simply click the icon in the upper right corner of the Edge Inspect window on the device. Alternatively, you can also click the refresh icon on the Chrome extension to refresh all connected devices simultaneously. Refresh will clear the cache on the device and request the freshest new assets from the server.
Debugging With Edge Inspect
The Edge Inspect capabilities covered thus far would be useful in and of themselves, but one of the best features of Edge Inspect is its debugging capabilities. When you click the Edge Inspect icon in Chrome, you'll see a "<>" icon next to each connected device. Clicking this icon will start a remote inspection session by opening the debugging panel. Edge Inspect uses weinre (web inspector remote, pronounced like winery) for remote inspection, though it will look familiar to anyone who has used Chrome or Safari's developer tools.
Once in the debugging panel, you can view and edit the DOM and see those changes reflected on the specific device you are using for debugging. You can view the console logs, even for most items that were logged during the page's onLoad event. As you probably know, these capabilities are quite powerful when debugging issues in HTML, CSS, and JavaScript.
There are currently a few limitations with debugging using weinre. The Timeline does not give any data, even when refreshed, and the Network tab only works for XHR. As you might expect, you will need to actually trigger button click and other events on the device (that is, you'll have to click the button on the device, not on your computer) to see the information sent to the Console. While you can edit HTML, CSS, and JavaScript, there isn't currently a means to add a new line—there is no Edit As Text or Edit As HTML options as in the Chrome developer tools.
For those of your familiar with prior releases of Edge Inspect under the name Adobe Shadow, you might be familiar with the fact that, by default, it relies on weinre servers hosted by Adobe. However, recent versions allow you to specify your own hosted weinre server by right-clicking the Chrome extension and choosing "options." If you are interested in how to set up a local weinre server to use, Joseph's RIA Lab blog post "Use your own Weinre server with Adobe Shadow – Step by step" provides a good walkthrough.
Another very cool feature in Edge Inspect is its integration with JS Bin. JS Bin is a very popular site that allows you to write, modify and test your HTML, CSS, and JavaScript snippets in real-time via the browser. Edge Inspect allows you to view only the output of your JS Bin scripts on the connected device screens, allowing you to live-edit what you see on your devices. In addition, clicking the debug as previously described will only be debugging the output, and even captures any console logs written into your JS Bin JavaScript snippets. If you want to see this feature in action, check out Remy Sharp's video demonstration on YouTube.
Screenshots With Edge Inspect
Edge Inspect lets you grab screenshots on any given device or all devices at the same time. To grab a screenshot across all devices, simply open the Edge Inspect extension in Chrome and click the camera icon. This will transfer screenshots from all connected devices back to your computer. Click the folder icon next to the camera to open the folder containing your screenshots. To capture a single device's screen, simply open the action menu on the device and click Screenshot. For example, Figure 3 shows a screenshot of my blog running on a Samsung Nexus S with Android 4.0 (Ice Cream Sandwich)
As you can see, I clearly need to work on this (though my design skills are famously lacking). Another interesting thing to note: the screenshot is the current viewport, so if you've scrolled, or even zoomed in before the screenshot is taken, the saved image will contain the actual viewport contents. In addition to the image, Edge Inspect saves a text file alongside it with useful details such as the URL of the page, as well as the page size, operating system, device model, screen dimensions, and pixel density. You can specify the location where Edge Inspect places the screenshots by right-clicking on the Edge Inspect Chrome extension and selecting "Options." I see this as being very useful for test teams who need to send developer notes explaining the exact nature of an issue they are seeing during testing.
Where To Go From Here
If you are building web applications that need to be tested on multiple devices (and, realistically very few of us should be building web apps and not testing on devices nowadays), then there is absolutely no reason I can see why you wouldn't immediately add Edge Inspect to your toolset. It is easy to set up, it is easy to use, it works with any IDE or editor, and it offers a number of capabilities you likely don't currently have. Most importantly, it will save you time and potential frustration.

Frazer Pugh
Author
Frazer Pugh is a distinguished expert in finance and business, boasting over 6 years of experience. Holding an MBA in Finance from Stanford University, Frazer's credentials underscore his authority and expertise in the field.
With a successful track record in executive roles and as a published author of influential articles on financial strategy, his insights are both deep and practical.
Beyond his professional life, Frazer is an avid traveler and culinary enthusiast, drawing inspiration from diverse cultures and cuisines.
His commitment in delivering trustworthy analysis and actionable advice reflects his dedication to shaping the world of finance and business, making a significant impact through his work.

Elisa Mueller
Reviewer
Elisa Mueller, a Kansas City native, grew up surrounded by the wonders of books and movies, inspired by her parents' passion for education and film.
She earned bachelor's degrees in English and Journalism from the University of Kansas before moving to New York City, where she spent a decade at Entertainment Weekly, visiting film sets worldwide.
With over 8 years in the entertainment industry, Elisa is a seasoned journalist and media analyst, holding a degree in Journalism from NYU. Her insightful critiques have been featured in prestigious publications, cementing her reputation for accuracy and depth.
Outside of work, she enjoys attending film festivals, painting, writing fiction, and studying numerology.
Latest Articles
Popular Articles
